Margin Tracking
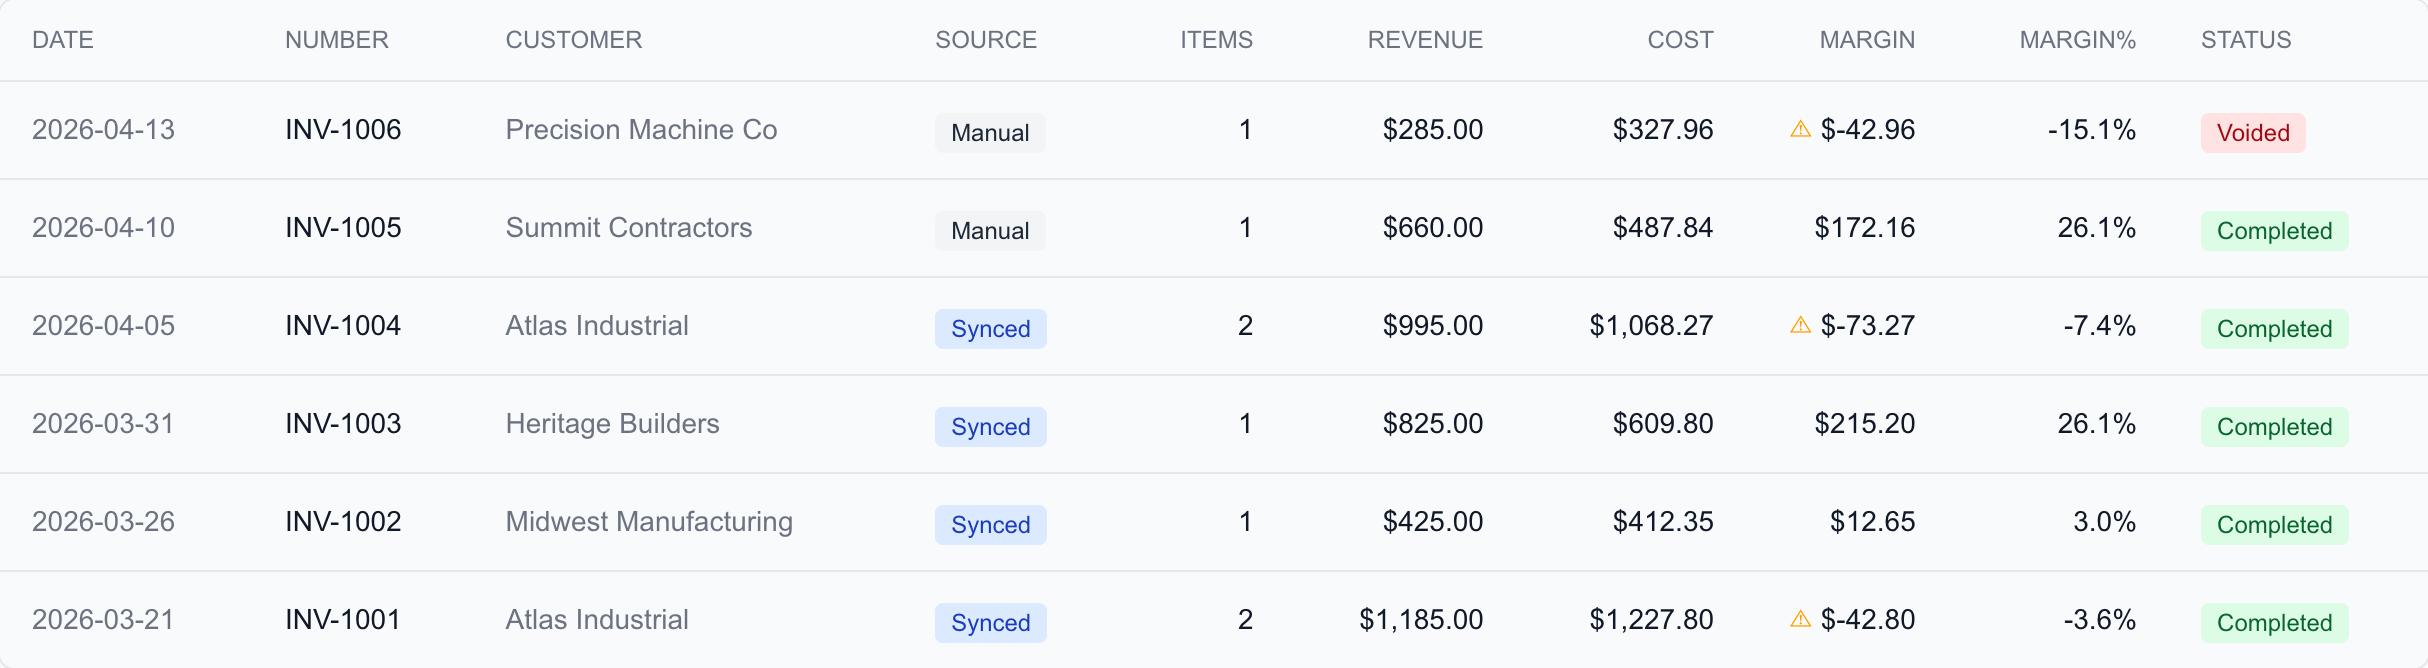
Every sale in Partsemble includes margin calculations at both the line-item and sale level. Because costs come from actual FIFO lot consumption rather than averages or estimates, your margins reflect what it truly cost to produce the goods you sold.
How Margins Are Calculated
For each sale line, Partsemble calculates:
Revenue — the line amount from the invoice (quantity × unit price).
Cost — the total cost of lots consumed to fulfill the line, determined by FIFO consumption. Each lot contributes its actual production cost per unit, so the cost reflects the specific batches that were sold. See Lot Consumption in Sales.
Margin — revenue minus cost, in dollars.
Margin percent — margin divided by revenue, expressed as a percentage.
Example: You sell 5 industrial enclosures at $285.00 each. FIFO consumption pulls from two build lots — 3 units at $145.00 cost and 2 units at $152.00 cost. The line calculations are:
| Amount | |
|---|---|
| Revenue | $1,425.00 |
| Cost | (3 × $145.00) + (2 × $152.00) = $739.00 |
| Margin | $686.00 |
| Margin % | 48.1% |
Sale-Level Totals
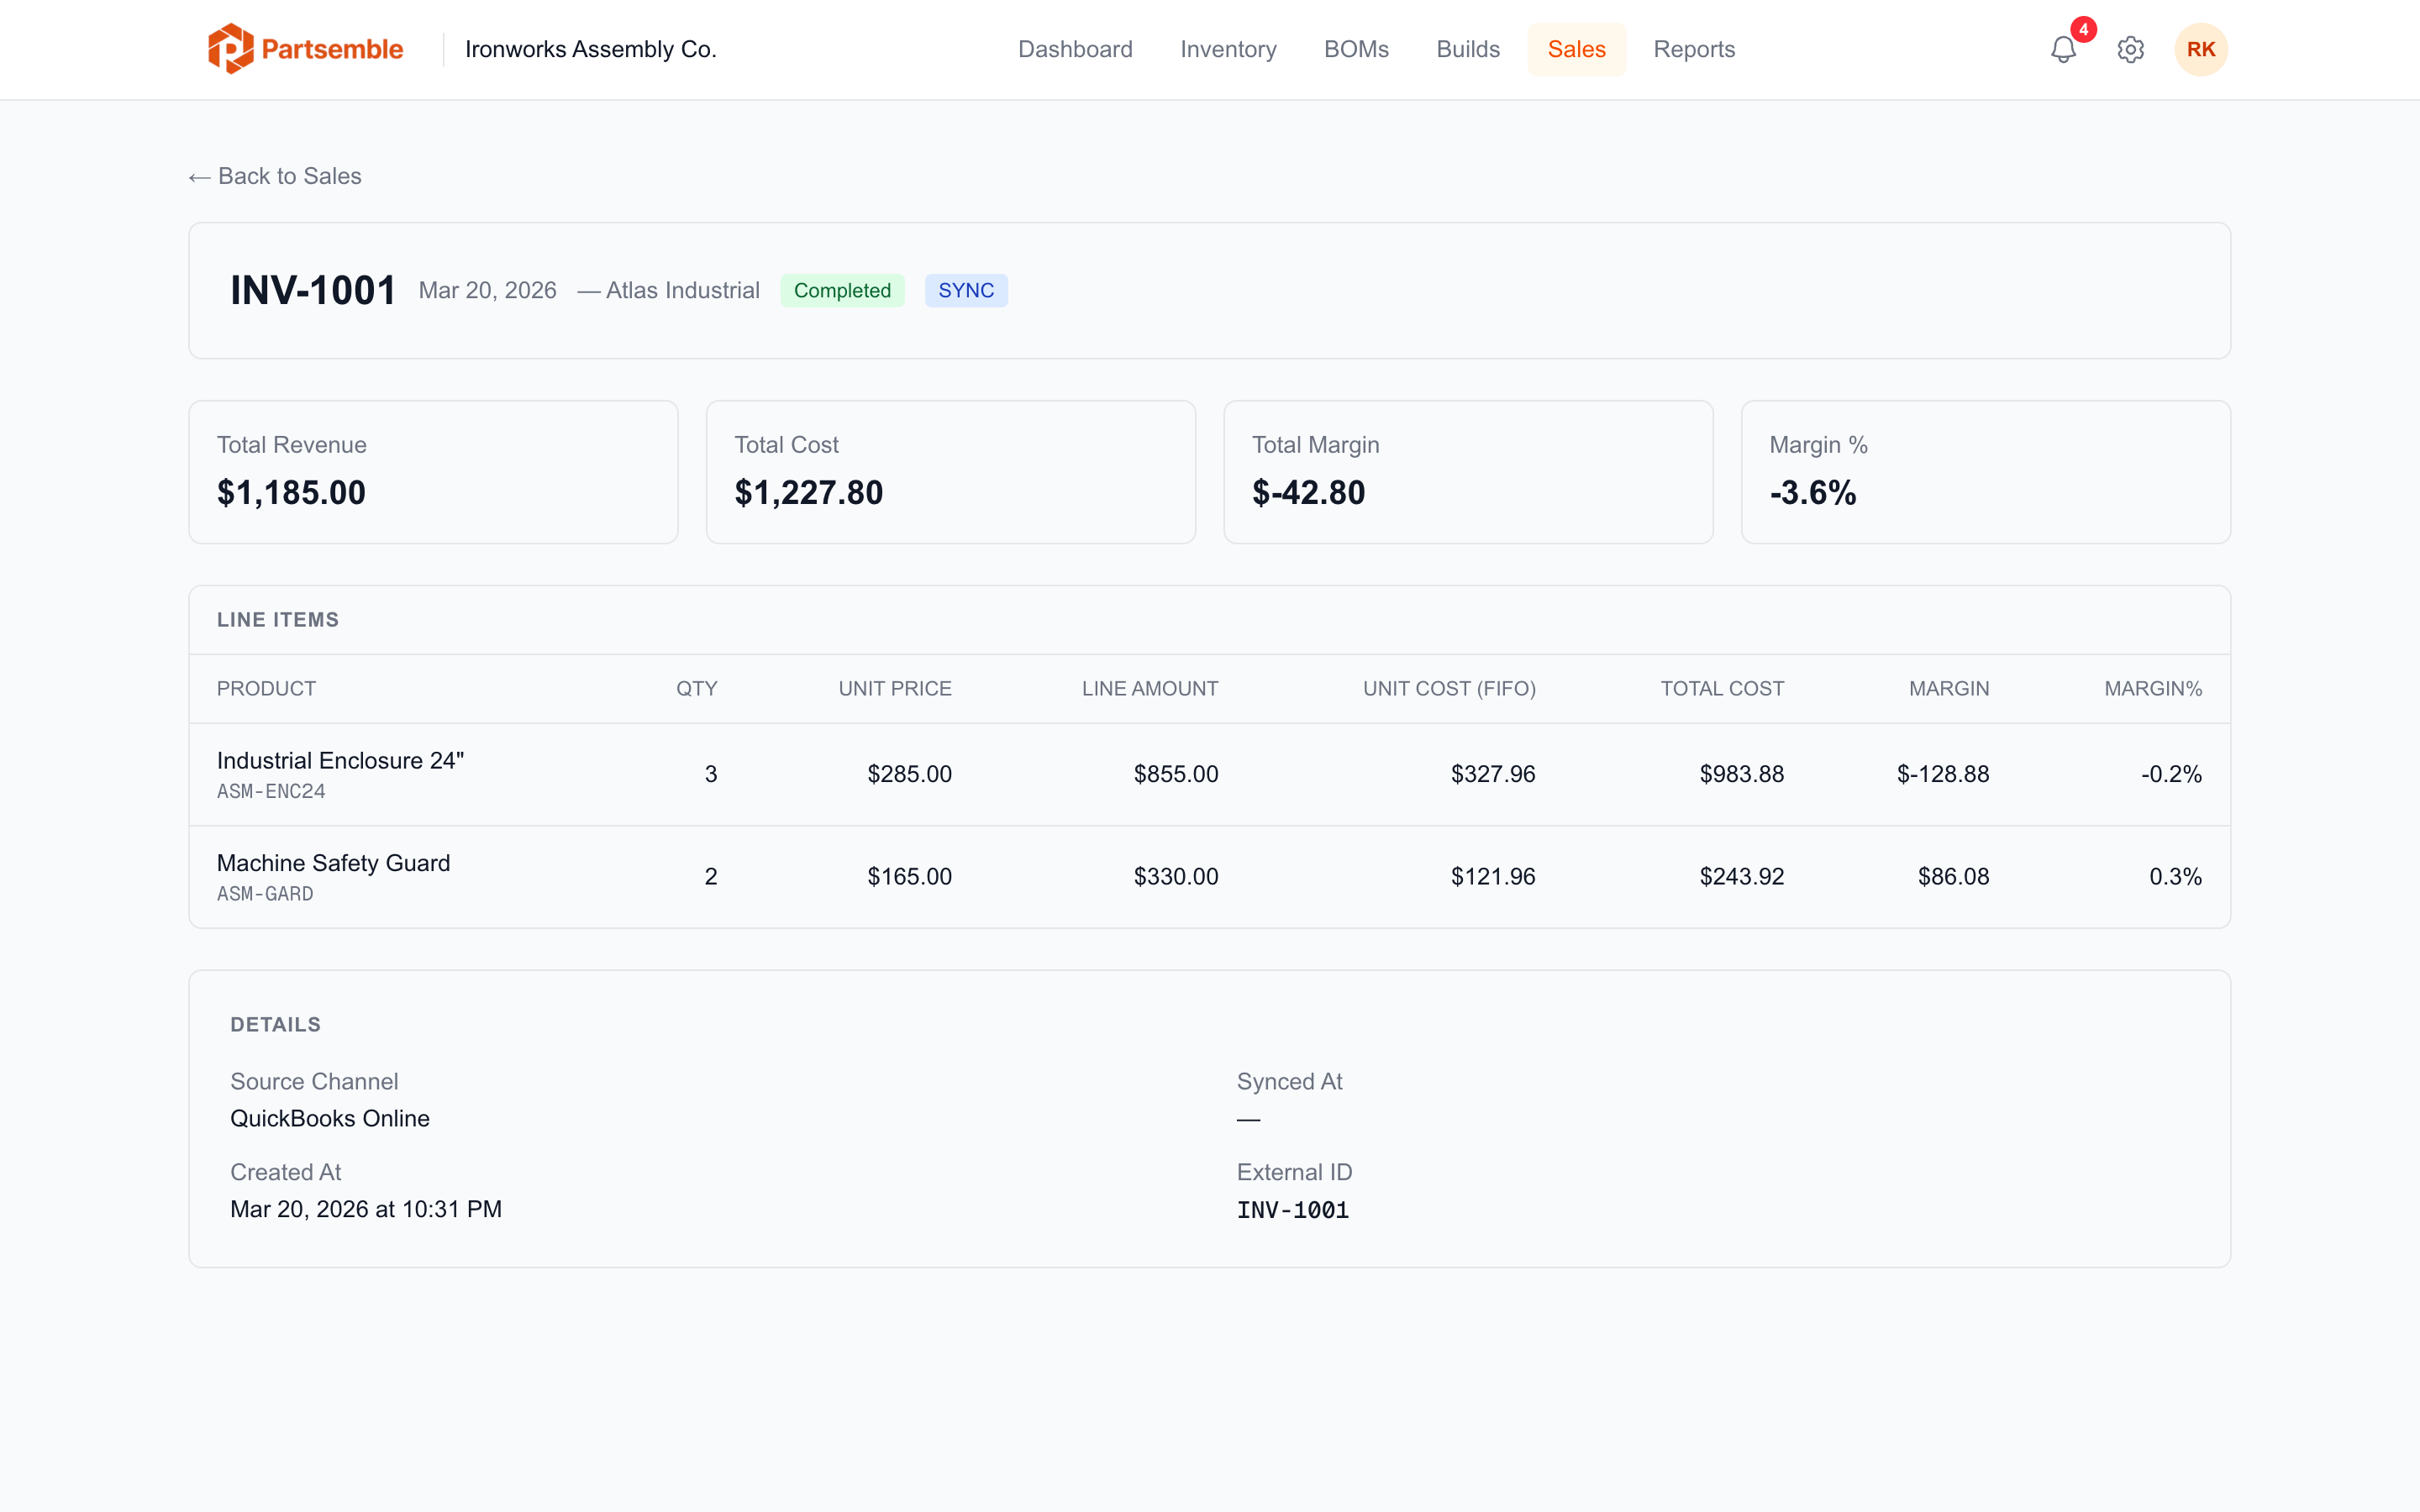
Each sale also shows aggregated totals across all line items: total revenue, total cost, total margin, and overall margin percentage. This gives you a quick read on the profitability of each transaction.
Per-Product Visibility
Because margins are tracked per line item, you can see which products are most and least profitable. A sale with five different products shows five separate margin calculations, making it easy to spot products where production costs are eating into your margins.
The Role of FIFO
Using FIFO lot costs instead of a simple average cost means your margins can vary from sale to sale for the same product, depending on which production batches were consumed. This is more accurate — if ingredient prices spiked for a particular batch, the sales that consume that batch reflect the higher cost, while sales consuming cheaper batches show better margins.
This is especially useful when raw material costs fluctuate. You'll see the real impact of cost changes flowing through to your margins as older (cheaper or more expensive) build lots are consumed first.
Stock Shortage Impact on Margins
When a sale line has a stock shortage (more sold than available in lots), the shortage quantity is costed at the product's weighted average cost. This means the margin for that line is partially based on lot costs and partially on the average — it's flagged so you know the margin isn't purely FIFO-derived. See Stock Shortages.
Where to See Margins
Sales list — the Sales tab shows revenue, cost, and margin for each sale in the list view.
Sale detail — click into any sale to see per-line margins, lot consumption details, and sale-level totals.